
Sochi Special: The Anatomy of a Race
We are now well past the halfway point in the speed skating competition, with only the one individual distance remaining for both ladies and men, then the team pursuits. True to form, the games has thrown up a lot of controversy, none more high profile than that concerning the suits worn by the American skaters. As I mentioned in previous articles, the suits don’t make a huge difference, and blaming the suits for the Americans’ shortfall in performance was ridiculous, but moreover wasted a lot of effort on something that didn’t make a difference, where that effort could have been spent on something that actually did make a difference.
But that’s not what I want to talk about. The original article on the suits, published in the Wall St Journal (which is a publication that I generally can’t take seriously these days, not only because of this, but because of the silly things they say about climate change) contained a quote that got me thinking:
Mr. Davis said his start in Wednesday’s losing 1,000-meter race was one of the fastest of his career. Normally after such a strong start, he said, “there’s no way, no way in hell, that I would post a 25.4 [second] lap.”
The rest of the US team is relatively young and inexperienced, and have a known tendency to perform well at high altitude venues (similar to where they train) and poorly on slower sea-level ice. Davis, on the other hand is a living legend in the sport, and has medals going back to the 2006 games in Torino. This experience, coupled with a proven track record of performing well at both high and low venues seemed to add more weight to the claim that the suits were making a difference. I didn’t buy it, of course, because I checked all the results and despite a poor placing, he actually went faster in both his 1000m and 1500m race than he did at this same venue at world championships a year ago.
So I crunched the numbers further. Before anyone gets worried, there isn’t anything very complicated mathematically happening here. I’ve just gone back and found his lap-splits in significant races and then plotted some graphs. I will present the data and my interpretations here.
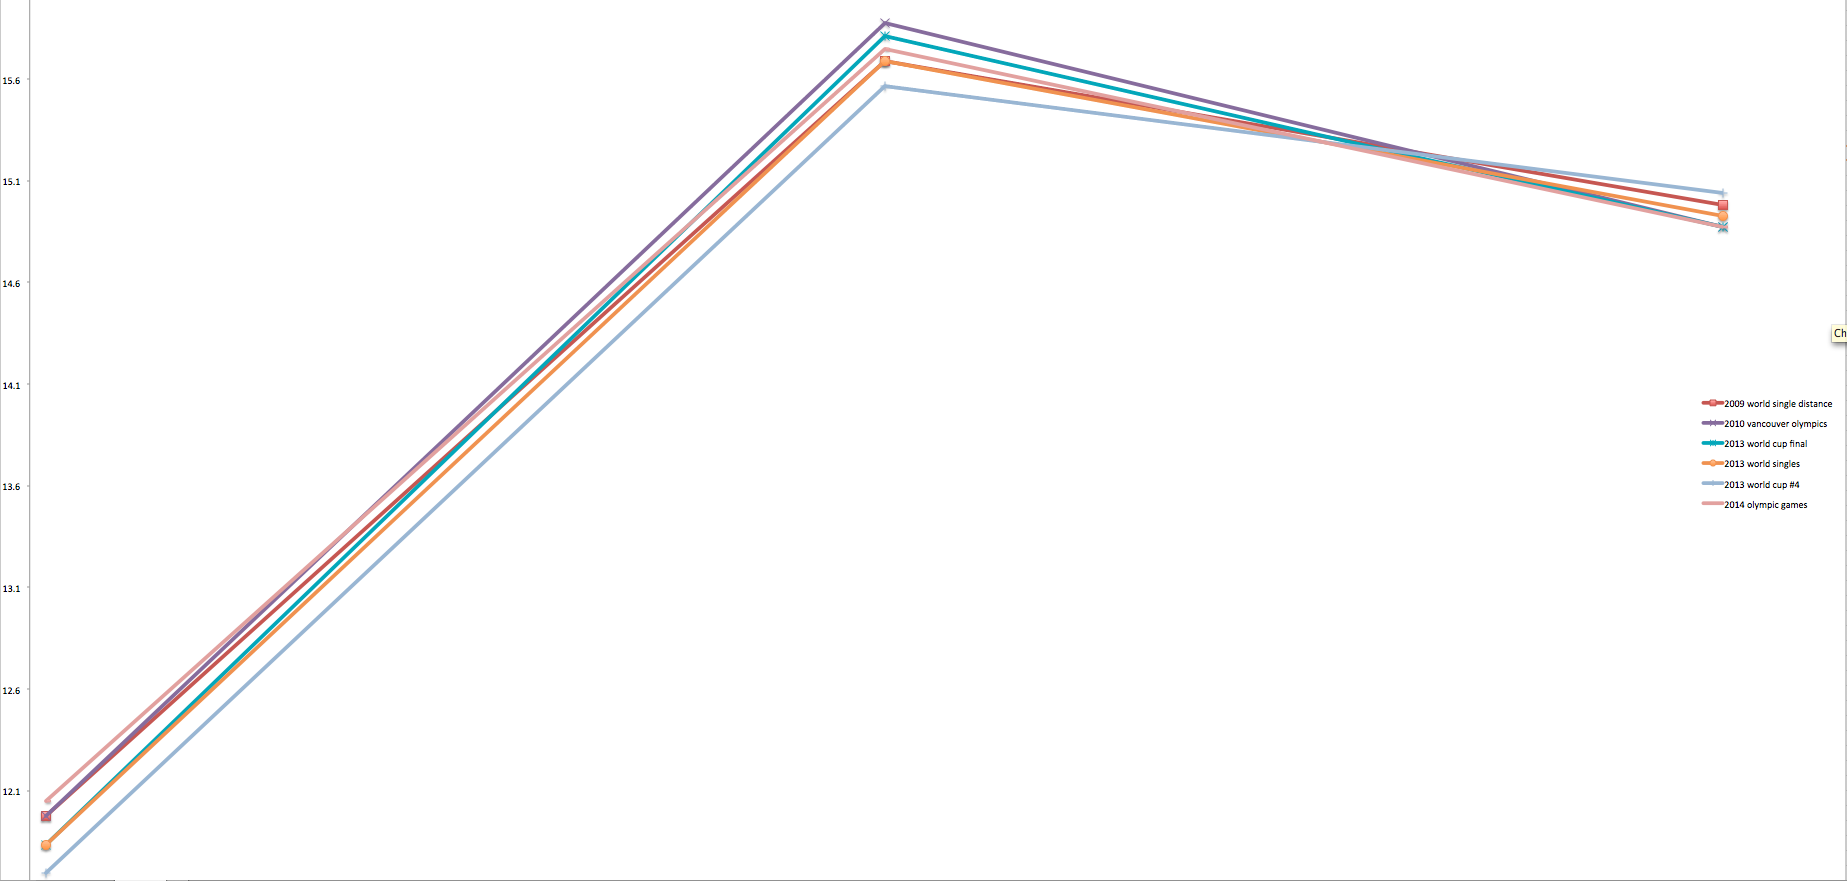
graph of speed over 1000m
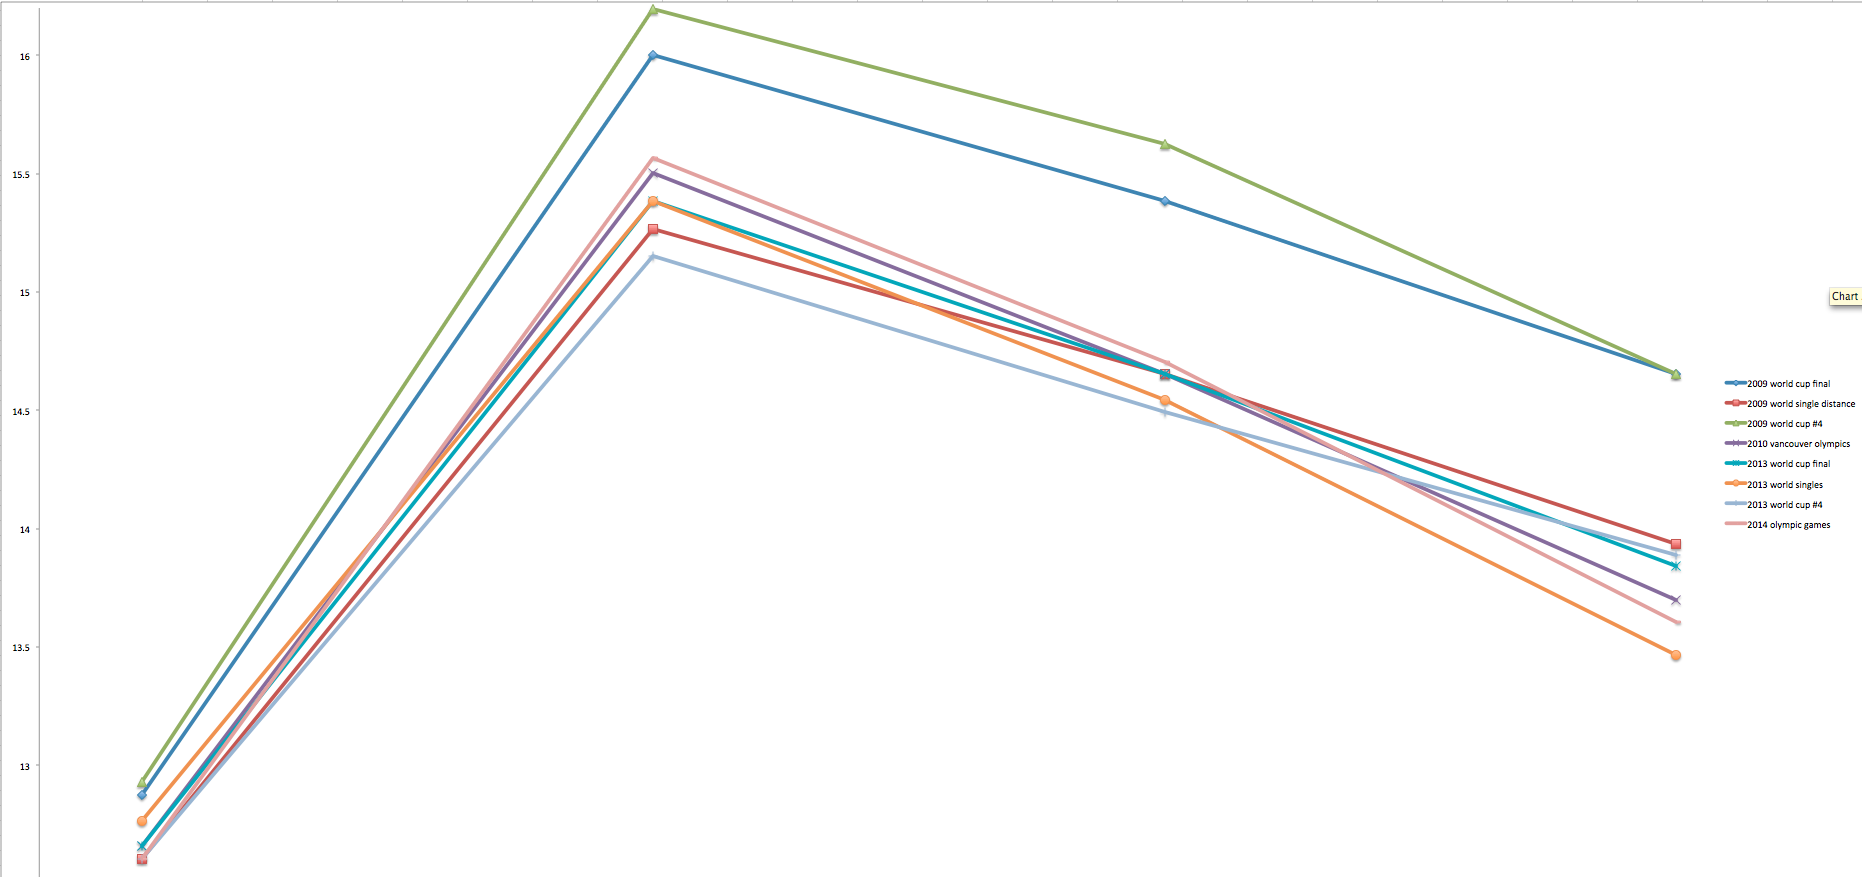
graph of speed over 1500m
(click on the images for larger versions)
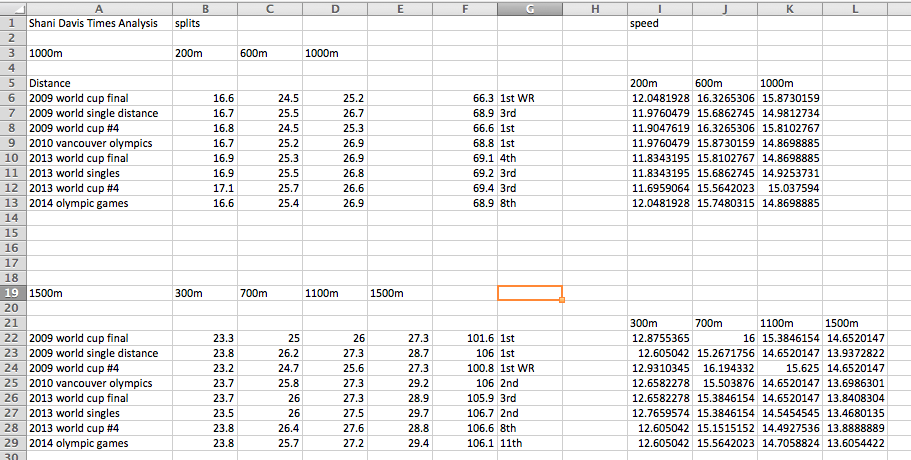
What numbers are we looking at?
For my data set, I’ve chosen two races from two seasons in two groups. Every season there is a major championships – world single distance championships, and in the year of the Olympic games, that is the world single distance championships. Every season, there are a series of world cup races – international competitions with tough qualifying criteria in which skaters compete for points and top ranked skaters at the end of the season receive cash prizes. The real prize from the world cup series is TV time, which allows skaters to sell logo-space on their suits to sponsors and this is what allows skaters to live and train full time.
So we have times from the major year-end competition, and the world cup immediately preceding it. We have this information for the 2008-2009 season, 2009-2010 season, the 2012-2013 season, and 2013-2014 season. Obviously, we’ve only taken the splits from Shani’s pet events, the 1000m and 1500m. In the margin I’ve made a note of his placing and if anything special happened, like a world record. In the far-right columns, I’ve divided the distance travelled by the time taken, to get the (average) speed in metres per second. I’ve used these numbers to plot some graphs, which you should click on because they took ages to colour in and get the axes looking good.
What do the numbers say?
Something I noticed, relating to the claim, is the last time Shani started a 1000m in 16.6 was at the 2009 world cup final, where he set the world record. This also happened in Salt Lake City which is at altitude and therefore possessing of much faster ice conditions. A fairer comparison would be to look at either 2009 world single distance championships or the 2010 olympics, which both took place at the same low-altitude venue. The opening split is similar, only a tenth slower, and the first lap is almost the same speed – for all three races. In fact the race at 2009 world singles was slightly slower in the first lap, then a little quicker in the second lap and Shani ended up with exactly the same time. At the games in Vancouver, he went significantly faster in his lap, then died more at the end. This turned out to be a winning strategy however, since he improved his time slightly and won the gold medal.
What strikes me about all of these times is how remarkably consistent he is. There are five full years between 2009 world single distance championships and the 2014 olympic games, and yet he skates almost exactly the same race. That to me is a sign of not only how strong a skater he is, but also how mature he is as an athlete.
The 1500m is a similar story, his opener and splits are very similar to those he skated previously. In particular look at what happens in the 2009 world single distance championships as well as the Vancouver games. He sets the exact same time but skates slightly different races. In 2009, he starts slower, and his laps are slower until right at the end, where he keeps his speed (better than anyone else too, since he won the race), while in 2010, he starts much quicker, with a first lap that is significantly faster than his race the year before, but he pays the price in the last lap, but ends up with the same time. In fact, his race in Vancouver should have been a warning for Sochi, because he actually managed to put in a faster first lap in Sochi, and while this allowed him to carry more speed over the second lap, he really paid for it in his last lap.
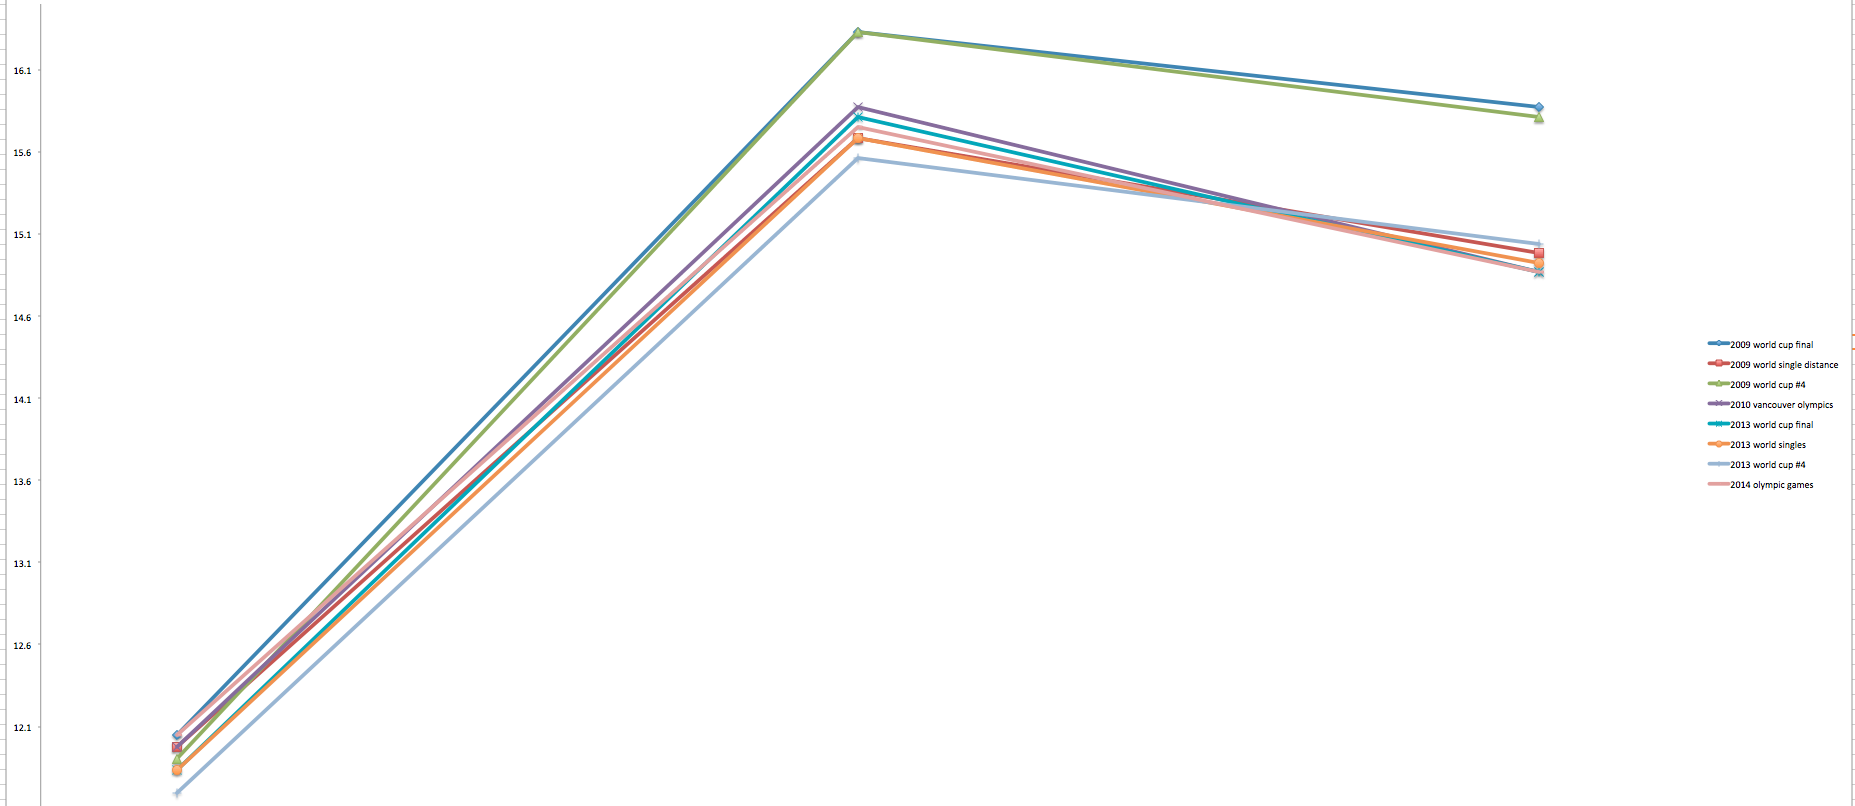
I’ve eliminated the two races skated at altitude from the graphs so you can more clearly see how the different races panned out (don’t forget to click on them for larger versions).
graph of speed over 1000m (low altitude venues only)
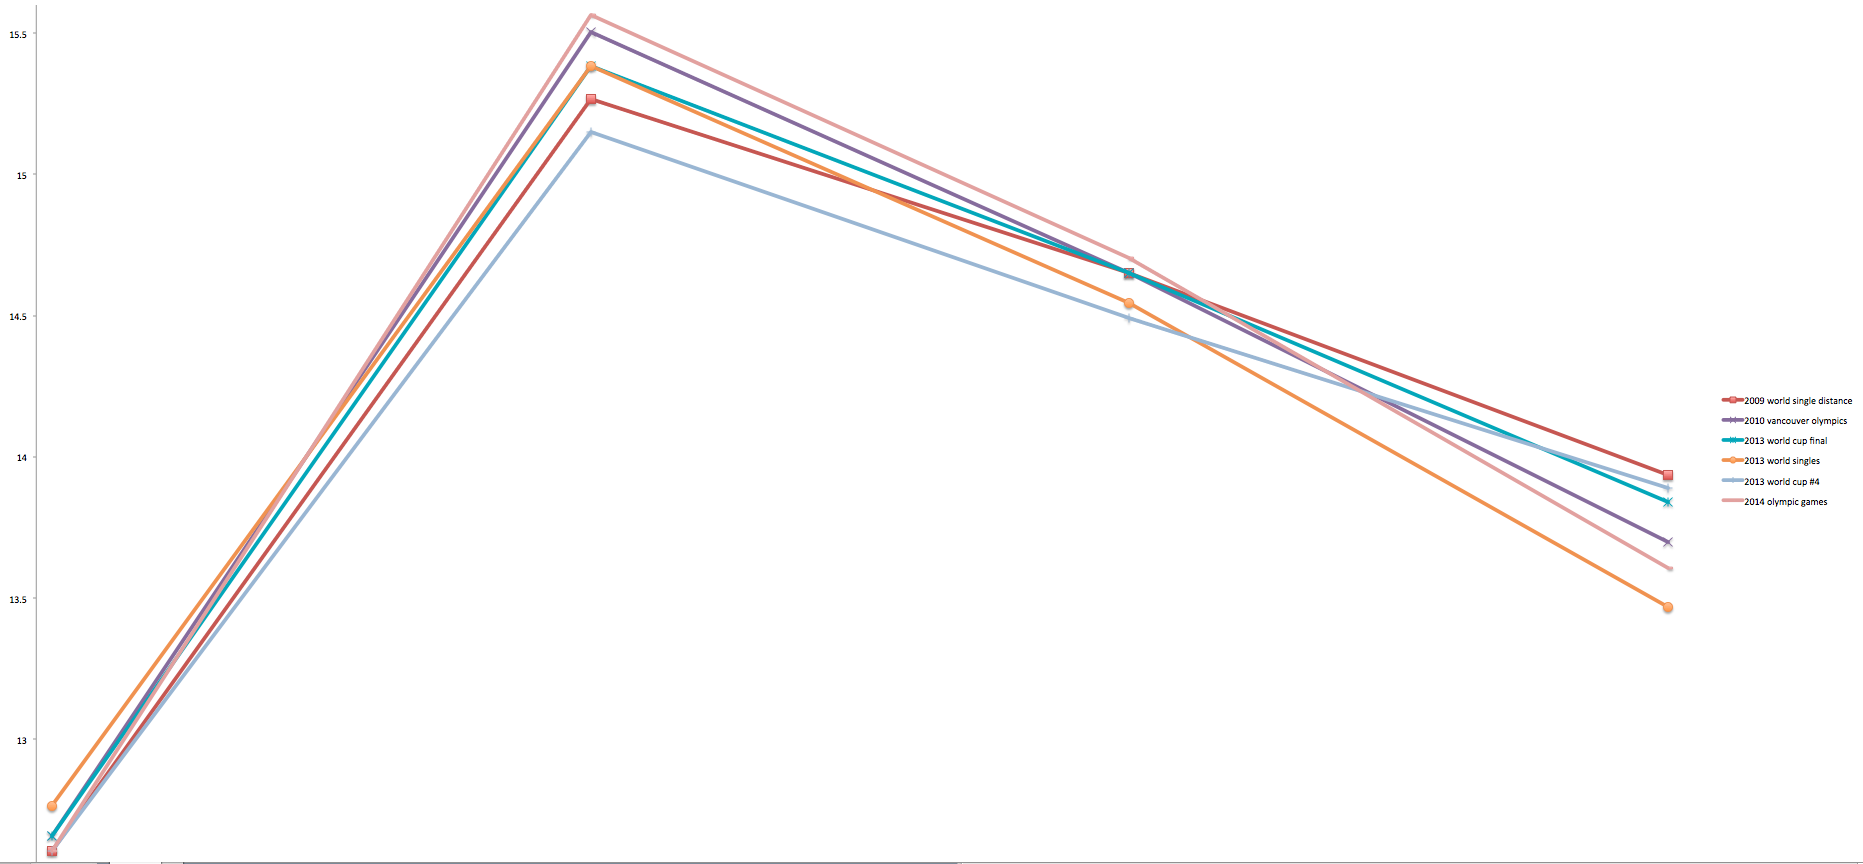
graph of speed over 1500m (low altitude venues only)
What do the numbers mean?
Shani Davis is a remarkably consistent performer. The data reveals an interesting tidbit about the way he peaks for the Olympics. It is almost impossible to infer what he does to achieve this, but for major competitions he is able to raise his maximum power output. This makes a lot of sense, and in a sport that is all about speed, and using the forces of your bodyweight, the corners, and your pushing against the ice to generate speed, power is the single most important factor in determining how fast you can skate. Out of all the guys I’ve trained with who have ‘mature’ skating technique, the fastest guys are the ones who can put down insane 5-second and 10-second wattage numbers on the power bike tests – wattages comparable to world class track cyclists.
What this means when we look at our graphs is that when he is more ‘peaked’ he will start faster and reach a higher top speed, often at the expense of his finishing speed. Not that that should really bother him – it’s the finishing time that is important. Surprisingly enough, despite executing slightly different races, and being more ‘peaked’ the time actually ends up being almost the same.
The times tell us something else too. He has essentially skated the same 1000m and 1500m race at all major championships which take place at low altitude venues. In other words, despite obviously having figured out how to peak effectively from a physiological point of view, he hasn’t figured out how to actually finish the races in a faster time. Previously this wasn’t a big deal because he was quite a dominant figure in these distances, but now others are figuring that out and are thus able to peak more effectively for the specific ice conditions that have been encountered at recent Olympic games.
(it also means that his quote from the WSJ has no backing as far as the facts are concerned)
Possible explanations
It is tempting to think that perhaps everyone else has gotten faster while Shani, now in his 30s, has simply been treading water. However, his world records from 2009(!) still stand, and more than that, they haven’t been seriously challenged by anyone. Only two people have gone under 1:07 in the 1000m and Shani’s world record is a full half-second faster than that, and nobody… NOBODY else has gone under 1:42 in the 1500m, and Shani’s world record is almost a full second faster.
I might offer a slightly different explanation. Others have figured out how to go faster on slower ice. The thing to remember is that the force due to wind resistance increases as a square of the velocity. This means that when you double your speed, you have to fight four times the wind resistance. At a high altitude venue, the air pressure is lower and therefore events like the 1000m and 1500m are about speed. They are about reaching the highest possible speed and then trying not to drop too much as your body runs out of energy and your systems are overwhelmed by lactic acid. When you start to get tired at a high-altitude venue, you are still able to hold more speed for any given power output.
However, when you go to low-altitude venues where the ice is slower, when your power output starts to drop, your speed will fall much more quickly. Even when Shani was skating well in the 2009-2010 season, he was stronger in the 1000m (gold) than in the 1500m (silver) because on slow ice, the 1000m is short enough to still be primarily about high speed, whereas the 1500m is sufficiently long to be about more than just a high power output, but also about being able to maintain a sub-maximal power output for a longer time. It is perhaps instructive to note that it was Mark Tuitert of the Netherlands who won the gold medal in 2010, and he lives and trains in the Netherlands, where the ice is low and slow, so he has had ample time to develop and refine a training program that peaks him for high performance on slow ice.
Another possible explanation is the skating calendar. In the 2009-2010 season, the four world cups in which people qualified for the shorter distances were arranged thus: Berlin, Heerenveen, Calgary, Salt Lake City. I’ve explained the Olympic qualification process in detail in a previous article, but basically you have to gather world cup points, and skate good times. Calgary and Salt Lake, being at altitude, are where everyone was peaking for to skate good times. It’s a delicate balance – you could forget about peaking for world cups and concentrate only on the games (the Koreans will generally do this) but potentially risk missing out on the games altogether if you don’t qualify. Or you could peak significantly for the qualification process, but then sacrifice a good performance at the games. Since the ‘important’ world cups were late in the season, this made it difficult and especially for countries like the Netherlands whose skaters not only had to worry about skating good world cup times, but also skating an extremely competitive Dutch selection trials within the same month, before shipping off to the games in February. Also, since the games were in Vancouver, this favoured the American skaters (more than the Dutch) as cultural and time zone differences were insignificant.
This time, in the 2013-2014 calendar, the Calgary and Salt Lake world cups were right at the start of the season, in early November, which meant that skaters from countries like the Netherlands could get in a reasonable gap between their peaks in early November, then late December, then the big one in mid-February. Although Russian culture is significantly different from that in a place like Holland, the culture shock and time zone changes would have had a far greater impact on the Americans who had, from what I’ve heard, a very hectic travel schedule immediately prior to the games.
The final word…
Either way, it was probably a combination of these and many other factors. It is unfortunate that the suits got so much attention when they probably weren’t a significant player in the whole equation. Altitude adaptation as well as the nature of physiological preparation were likely to be the real causes of the ‘disappointing’ performance of a very popular and well-respected skater in the community. I just hope that by analysing the numbers, I’ve been able to put to rest many of the sensationalised claims of ‘disastrous performances’ and ‘out-of-character racing’. At the end of the day, this was just another race, and he didn’t do very differently to how he had done in the past, but this time there were more people who could give it that little bit extra and beat him.
Just to keep things interesting Pyeongchang, Korea (host city for the next winter games) is at altitude.
Don’t forget to click the sochi2014 tag to read my other articles about the games. There are now five(!) feature articles to keep you occupied on this speed-skating-less day: speed suits, the differences between long track and short track, how it is NOT about the suits, and the timing equipment. This is all in addition to my daily recaps and previews of speed skating events. Any requests, questions, or suggestions for articles are most welcome.
Useful Links
Sochi 2014 schedule and results for speed skating
Database of results from ISU world cups and championships
Great stuff, Daniel. It certainly fits into what I noticed, analyzing the data from the 2013 world single distance championships — the only previous major event held at Adler Arena since its opening in 2012. (There have been no World Cup races there.) You can see that while the Americans have in fact improved their times at the Olympics quite significantly from WSDC, skaters from other nations have improved by much greater amounts. While Heather Richardson improved by 0.87 seconds in the women’s 1000, for example, the Chinese skater who won the race at the Olympics improved by 2.46 seconds. That’s just amazing. And if you were to look only at the WSDC in establishing expectations for the U.S. at the Olympics, you probably would not expect results as soaring as many Americans seemed to expect, based apparently on recent World Cup results. Although Shani Davis did win silver and bronze in his best races, Heather Richardson and Brian Hansen did not medal at all, and Brittany Bowe managed only a single bronze. Meanwhile, the Dutch won 13 of the 36 medals on offer, including six gold.
Force due to wind resistance, aka drag, actually increases exponentially with velocity.
No it doesn’t. Force due to drag is calculated by:
1/2 multiplied by air density multiplied by the velocity squared multiplied by the frontal area multiplied by the drag coefficient multiplied by the unit direction vector (since the force is a vector)
so it is the second power – the square of the velocity
In more detail, as it relates to altitude:
http://www.danielyeow.com/2009/on-skating-at-altitude/
I was going to comment as well that drag, most assuredly, increases as the square of velocity.
Great article! I don’t know too much about the sport but had suspected the claim on suits was false. I like seeing the hard facts. Well done.
Very thorough analysis Daniel! Great article to read!
That was fantastic!
In the men’s 1,500, the skaters completed the race in about 105 seconds. So if my math is correct, the margin of victory (.003 seconds) was less than 2 inches. However, the winner started on the outer and the second place skater started on the inner. They didn’t skate the same track for the first 300 meters. Are you confident that the measured length of first inner and outer curves and the offsetting stagger at the start are measured precisely to within 2 inches? If not, perhaps the race shouldn’t be timed to the thousandth of a second. I’d call it a tie.
Actually, I know quite a bit about how the tracks are configured and measured and I’m very sure that the measured length of the tracks from a starting position on either the inside, or the outside lanes is exactly the same, over any distance.
The technology is pretty good, and we control all the controllables very well… but there are *still* little things that are outside of our control which make a big enough difference that I think that 0.003 of a second is too small a margin to be able to definitively say that one performance was better than another.
Also, this comment, and my reply belong on the page about timing equipment…