Drawing Molecules
When you were a little kid, you probably came across quick step-by-step guides in children’s books on how to draw things. These things were probably pandas and elephants, and for the adventurous, platypuses. However, as you grew older, and as your education expanded to include step-by-step introductions to things like differential geometry, the guides to pictorial representations of things that were important to you seemed to just disappear.
Indeed, it is a grave fault of most education systems that artistic skills are not taught as rigorously as so-called academic skills as students grow older. Furthermore, society has a tendency to pigeon-hole people into either being scientific, or artistic in a way that implies that both are somehow mutually exclusive. Of course, often too late, people realize that to be a very successful science-person, one needs creativity, which isn’t explicitly encouraged until students are almost ready to go into research. My views on the faults of modern educations systems are perhaps best left to another post, but for now, I present a how-to guide for drawing molecules.
Molecules are beautiful things. You take these little things called “atoms” which generally consist of protons, neutrons, and electrons. The number of protons determines which chemical element the atom is classified as, and also tends to determine the number of electrons which orbit the nucleus. For reasons far beyond the scope of this article, these electrons are arranged in “shells” around the nucleus and these shells tend to “prefer” a certain number of electrons to be in them. This desire to complete the shells causes different atoms to come together and share electrons in what are called “covalent bonds” (I encourage the curious reader to read further). This is how we get molecules.
I drew my diagrams with the purpose of assisting a friend who is completing her PhD in Chemistry. Not being trained in the use of graphics software, most of her diagrams had consisted of crudely-scanned drawings borrowed from other papers, as well as the occasional drawing made using Microsoft Power Point *shudder*. Obviously, if power point can produce a usable result, then that’s fine, but in my eyes, this is similar to calculating the area of a circle using 3.1 instead of ![]() .
.
I first learned how to use graphics software while in high school, during a time of my life when I wanted to be a graphic or industrial designer. I eventually switched to mathematics because I thought it was more beautiful and thought I would never use those skills again. However, they became very useful when I came to write my honours thesis and I was in need of some mathematical diagrams.
Graphics software is generally fairly easy to use, though most packages are so feature-packed that they can seem overwhelming and it can take quite some time before you can use them with any kind of “fluency”. For scientific diagrams, I like to use Adobe Illustrator. Illustrator is an example of a “vector graphics editor” which means that, unlike a “bitmap graphics editor” images are not saved as a set of pixels with specific values assigned to each, but instead are a set of instructions. When you draw a circle in photoshop, the image is a bunch of points with position values and colour/brightness values. When you draw a circle in illustrator, it is saved as a coordinate for the center, radius, border colour, fill colour.
Bitmap editors are ideal for things like photographs, but for technical drawings, vector editors are preferable. This is because images are infinitely scalable, and complex diagrams are reduced to an easy-to-manipulate instructions set, rather than a difficult-to-separate bunch of pixels.
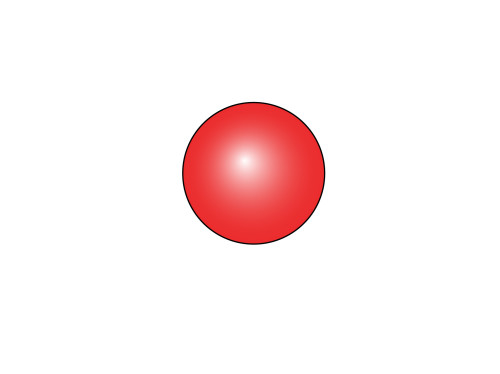
Let’s draw a circle, and fill it with a “gradient fill”. I made the gradient go from white to red, and made it radial, to give the illusion of a three-dimensional ball. This is our first atom.
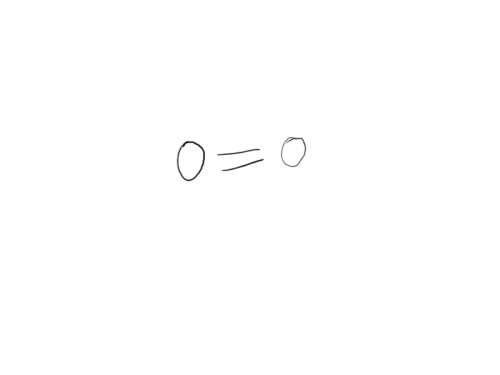
Take oxygen (you have to, otherwise you would suffocate, har… har…). Its atomic number is 8, so it has 8 protons and 8 electrons (it may have any number of neutrons, but usually has 8). It has an s-shell and a p-shell. The s-shell has two electrons in it and is full, while the p-shell has six, and is two short of its optimum number. The oxygen atom meets another oxygen atom and finds that if they both share two electrons, then they can complete each others’ p-shell. Since they share two electrons, this bond is called a “double bond”. We begin our drawing by first laying out a diagram of the structure:
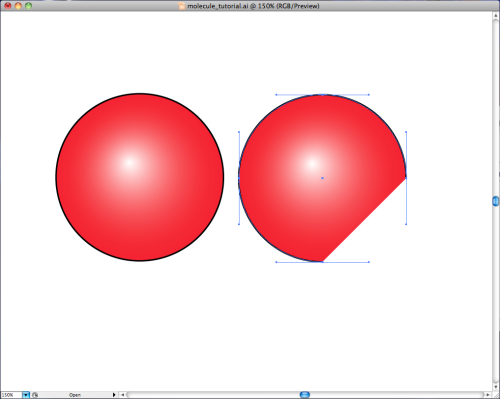
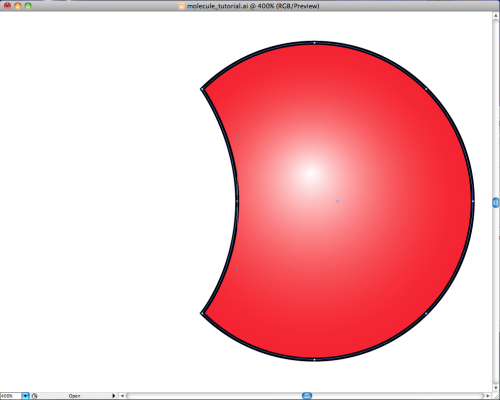
Simple enough. Now we take two red balls like the one above, and we slice a bit off the side of one like so:
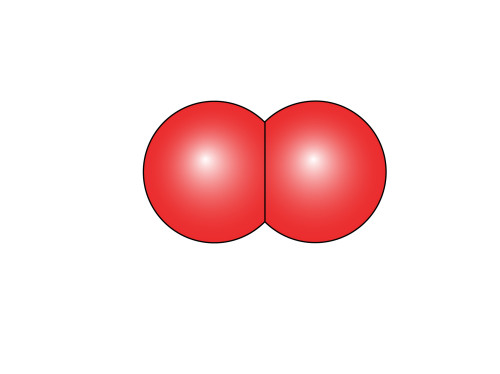
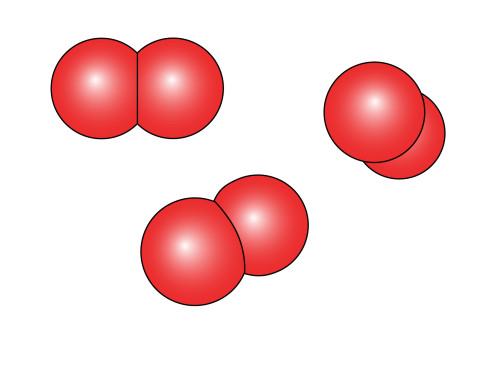
Then all you do is rotate the oxygen atom on the right by 135 degrees in the clockwise direction and then put the two together to get our tidy little representation of ![]() .
.
If we want to be really tricky we can modify this diagram slightly to make it even more “realistic”. In vector drawing programs, lines are generally called “paths” and they are defined by points. When lines pass through these points, they can change direction abruptly resulting in a zig-zag effect, or the can pass through the lines smoothly. A combination of these is used for the right effect. So let’s take our sliced oxygen atom and add a point to the path in the middle of the straight line. Then we make that point one of those “smooth” ones (technically speaking, they’re knots in a spline). The two points at either end of this line remain as the non-smooth type, and we end up with:
It is perhaps difficult to see the usefulness of going to all that trouble until one observes the finished result. Varying the curvature of that cut-out can vary the apparent viewing angle of the molecules. Other little tricks like making the atom in the pair that is furthest from the observer slightly smaller, also adds to the 3D “pop” of these illustrations.
Of course, beyond a certain point the curvature of the surface of the nearest atom of the pair obscures the curved surface of the point at which they join (such as in the example on the far right). In this case, one can simply place one circle on top of the other and with a slight offset.
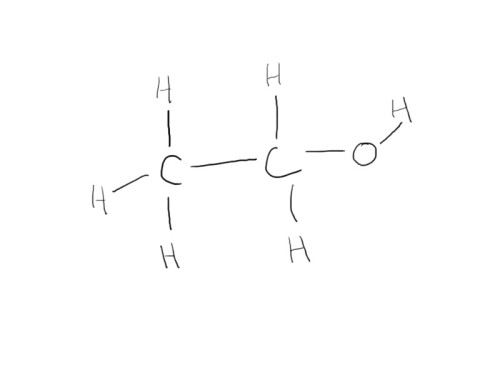
Let’s try something more difficult. How about some booze? The layout of the molecule for ethanol is as follows:
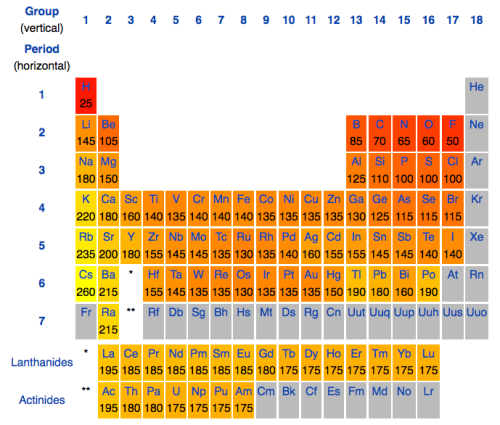
Now anyone who’s done even a little bit of high school chemistry will know that the atomic number for hydrogen is 1, and the number for carbon is 6. Oxygen’s is 8. When visualizing this, we must remember that the atoms will be different sizes. Fortunately, others have gone to the trouble of measuring atomic diameters so we don’t have to, and there are many lookup tables available on the internet. Here’s one I ripped off wikipedia:
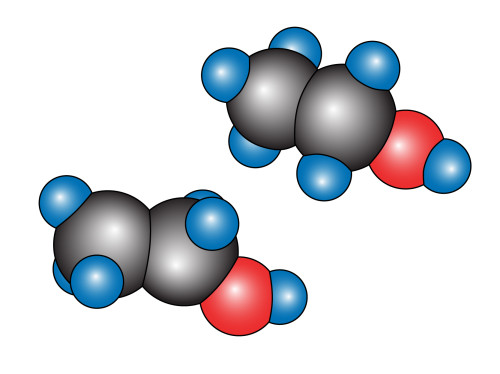
So, as we can see, oxygen is slightly smaller than carbon, and hydrogen is way smaller than either of the two. Next we have to consider the geometry of the molecules. This can actually get pretty complicated because the shape of different s, p, d etc. shells differ in unusual ways. Fortunately, for the first few elements of the periodic table, much is already known about the way they form bonds. Carbon (which wants to form four bonds) likes to form them in a tetrahedral way, while oxygen seems to form its bonds at 109 degree angles. Taking all these into consideration, we end up with:
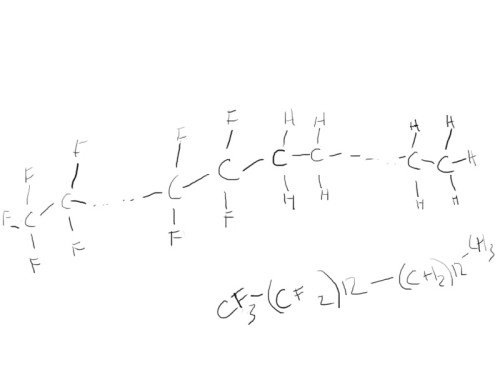
So these are relatively simple molecules. When we draw more complex molecules, we often have to proceed slowly and in stages, otherwise we get confused (or at least I do). Let’s try a surfactant. For this example, I’m just going to use fluorinated compound of ![]() . First I start out with a rough sketch of what it’s going to look like:
. First I start out with a rough sketch of what it’s going to look like:
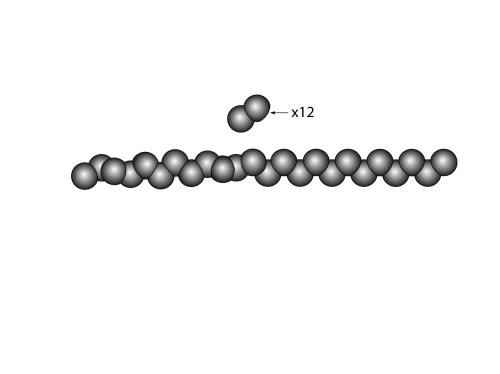
It’s just one long chain of carbon atoms where one end is attached to mostly hydrogen, while the other is bonded to fluorine. So we begin by simply drawing a long chain of carbon atoms. However, I’ve drawn one half in a slightly unusual way. The reason I’ve done this, is because I happen to know that long chains of ![]() have a tendency to twist the carbon chain because they’re so “full”. The hydrogens, however, do not present a problem, so the chain for that section is very regular.
have a tendency to twist the carbon chain because they’re so “full”. The hydrogens, however, do not present a problem, so the chain for that section is very regular.
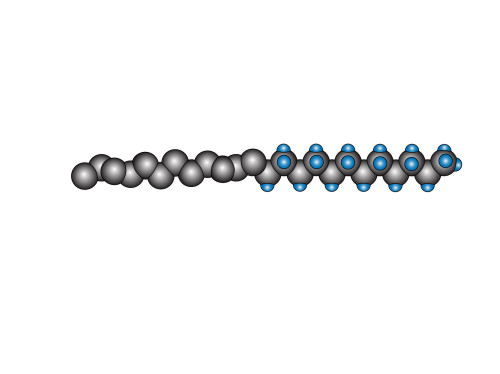
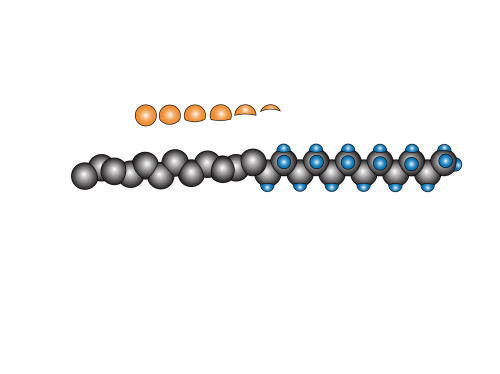
The next step is to put on the hydrogen atoms. This is relatively easy. (six carbon atoms are obscured from view)
Now, due to the twisting nature of the fluorinated part of the chain, putting the fluorine atoms on is more than a simple matter of drawing it once, then copying it 25 times. The angle from which these atoms are viewed changes with every successive pair. So instead, I begin with a “palette” of different atoms (which look a little bit like moon phases).
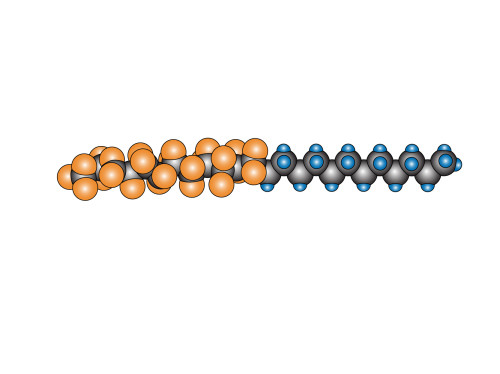
Finally, I stick them on. I look at where they are and then select the most appropriate fluorine atom. Sometimes I make slight adjustments. By the time I’m done, it looks a bit like this:
where hopefully it is a little easier to see the twisting that I was talking about before. The observant reader will have noticed that, just looking at the diagram, there seems to be no real reason why the fluorine section couldn’t have been straight and regular like the carbon one. However, there’s more to it than what is represented in the diagram, and we need to remember that this is simply a representation to help us visualize what’s going on (in the case of this surfactant, we have a hydrophobic “tail” section – the bit with all the fluorines, and a hydrophilic “head” section. Many surfactants also have an OH-group on the head which is even more hydrophilic because it forms hydrogen bonds with water molecules).
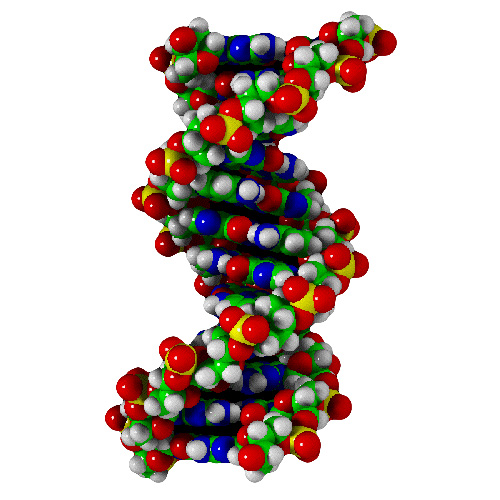
Molecules do, of course, get much more complicated. Much larger molecules exist, such as crystals, which are often, essentially, one giant molecule. They are, however not difficult to draw because of their very regular, repetitive nature. Right at the top of the complexity ratings of course is DNA, so to finish off…
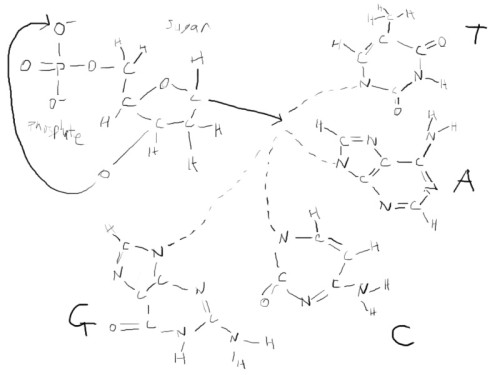
so we begin our little diagram
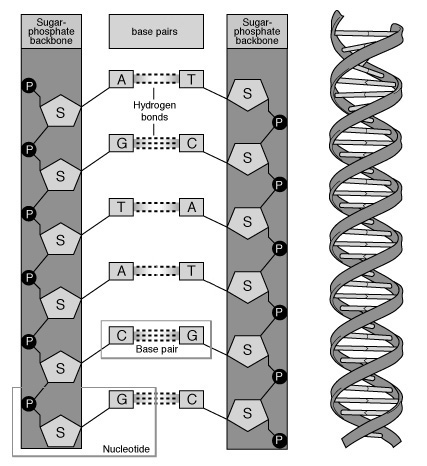
So… we have these phosphate-sugar bits on the sides that act like railroad tracks. In the middle, you have base-pairs guanine (G), cytosine (C), adenine (A), thymine (T) in which is contained our genetic information. So you take the above, and you set it out in a ladder:
Then we twist it into shape. Since I can’t be bothered drawing such an enormously complex molecule (or even a small part of one) I present an example that I ripped off google image search.
…and it replicates.

Thanks Yeowie, a nice entry for my “bizarre” page – what a gem!
You might like to look at Povray, a free ray tracing application. I think it will appeal to a mathematician. You describe the scene in a C like language and let it draw a picture for you.
– Position primitive shapes (spheres in this case) in 3D space.
– Apply a colour, or a more complex surface texture if you wish.
– Position light sources.
– Position a camera.
– Generate an image.
The Windows version also has a GUI with ready made scenes in the include menu so you can generate a simple image very quickly.
As you get more advanced, you can use the language #declare statement to define ready to use objects for atoms, bond lengths etc.
For the next step – animation 🙂
Look at http://www.povray.org
Regards
Jim
fasinating and intresting
Molden, VMD or Avogadro. Just click shit together and you’re done.
This website fucking sucks and I hate it.
MAKE A WEBSITE ON HOW TO DRAW SHERK YOU FUCKING PIECE OF SHIT!!!!!
I WANT TO LEARN HOW TO DRAW SHERK FUCKING DONKY! DANNY FUCKING DO IT YOU PUSSY!!!!
wow
uhhhhhhhhhhhhhhhhhhhhhhhhhhhhhhhhhhhhhhhhhhhhhhhhhhhhhhhhhhhhhhhhhhhhhhhhh