
Explaining the Vortex
Recently, much of North America (and it should be noted: ONLY North America) has experienced a brief period of record low temperatures as a result of the unusual but not unprecedented southern movement of the Arctic Vortex (sometimes also referred to as the Polar Vortex). One of the more infuriating things to come out of this course of events are ‘climate change skeptics’ declaring that it “proves” that global warming is a hoax… and so continues the Earth Debate.
There are many flaws, on many levels, to this argument. Most obviously, a short period of locally cold temperatures has no real impact on conclusions derived from a long term global trend. People from the United States in particular, long famous for their ability to project their own narrow experiences as somehow representative of global views (e.g. baseball’s “World” Series), have merely forgotten the existence of the rest of the world, as well as the vast amount of time which has passed before the previous month. My “conversations” with climate change deniers on the internet have reflected this as I am hit with countless quotes of temperature readings from various weather stations (all of them located in North America, further illustrating that they’ve missed the point) in the hope that such data somehow disproves the overwhelming body of evidence contrary to their point of view.
It occurred to me recently that it may be more useful, instead of engaging with a bunch of people who have decided to never ever change their minds, to explain why this vortex came so far south. The science behind it is quite well understood (as is the science behind climate change) and this unusual behaviour is consistent with the theory of anthropogenic global warming. A single unusual weather event will never prove global warming, but the increased frequency and severity of these events merely adds to the (already overwhelming) body of evidence in favour of it. Even so, a person’s experience can be deceiving and perception can be at odds with cold hard facts – believe it or not, in the period from December 6th to January 5th in the US, there were 999 instances of record high temperatures compared with 254 of record low temperatures. The same period saw 7 monthly highs and no monthly lows. Predictably, my linking to data such as these is routinely stonewalled by my internet ‘debate’ detractors and ‘counterargued’ with more repetition of single weather station data, or worse – theories of the grand socialist conspiracy of climate scientists, led by the gay agenda.
Atmospheric Circulation
You will probably have heard a lot about the jet stream and how it’s winding (more than usual) path brought the vortex down south. This is true, of course, but what is the jet stream? Why is it so squiggly? And what does any of this have to do with climate change. To grasp this, we must first understand the basics of atmospheric circulation.
In brief, the sun heats the surface of the earth unevenly. This gives rise to convection currents which form circulating ‘cells’ of air within the atmosphere. These large-scale circulation systems, influenced by the Coriolis effect (a side-effect of the earth’s rotation), result in prevailing winds. Gaps between these cells are filled with ‘rivers of air’ which are driven by a combination of the temperature gradient, and the Coriolis effect – this is the jet stream. A large difference between the temperature of the equator and the poles results in a stronger jet stream, and vice versa. A strong jet stream is generally straighter while a weak jet stream is more squiggly.
A more detailed explanation (with diagrams!) follows:
Convection
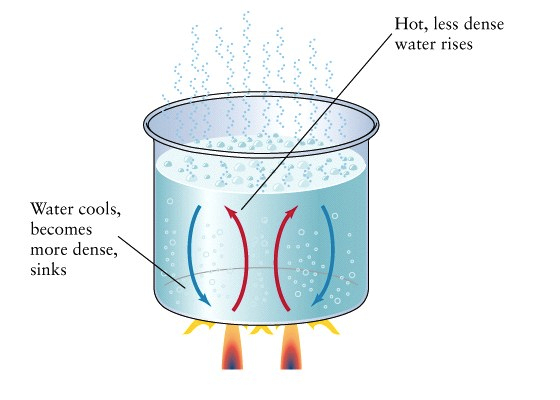
All of our heat comes from the sun. The sun’s radiation mostly passes straight through the atmosphere (actually some of the blue wavelengths are scattered by the particles in the atmosphere, which is why the sky is blue) and hits the ground. The ground reflects some of the energy, and absorbs the rest. This causes the ground to warm up. Not surprisingly, this warming happens the most in tropical regions where the angle of the sun is nearly perpendicular to the earth’s surface. Nearer the poles, the angle of the sun’s rays is greater, meaning the same amount of energy is spread over a larger area resulting in less effective heating. The warm ground near the equator heats up the surrounding air and this warm, less-dense air begins to rise in much the same way as water in a heated pot (diagram above).

Circulation Cells
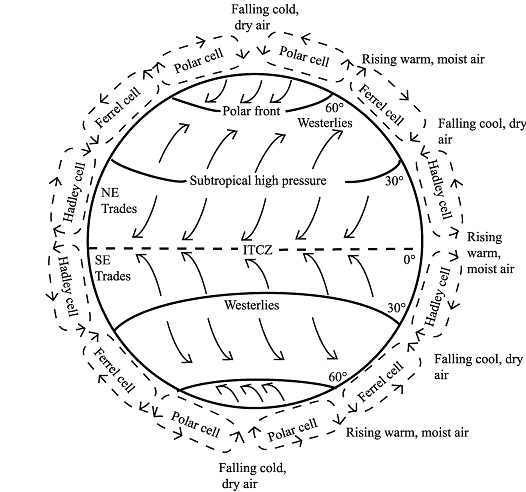
Since the atmosphere is much flatter and more spread out than it is in a pot, various circulation cells form (diagram above). The diagram is very simplified, of course, since there are mountains, an uneven distribution of landmass, as well as ocean currents which all have an effect on atmospheric circulation. As an interesting aside, you’ll notice that the latitudes of 0 degrees and 30 (approximately) are referred to as the doldrums and the horse latitudes. This is because it is in these locations where the air is either going straight up or straight down, which means that there’s very little wind. If you were a sailor, having no wind would get you down in the dumps, with that feeling of not getting anywhere (doldrums). It might even get so bad, that there isn’t enough food for both you AND your horse, forcing you to cast your beloved companion overboard (horse latitudes).
So how does this affect our overall picture? These extremely large bodies of circulation are subject to the Coriolis effect. As many people learned from The Simpsons, the Coriolis effect causes toilet flushes to spin in a different direction in different hemispheres.1 In a slightly less-important aside, this effect also applies to hurricanes.
Prevailing Winds
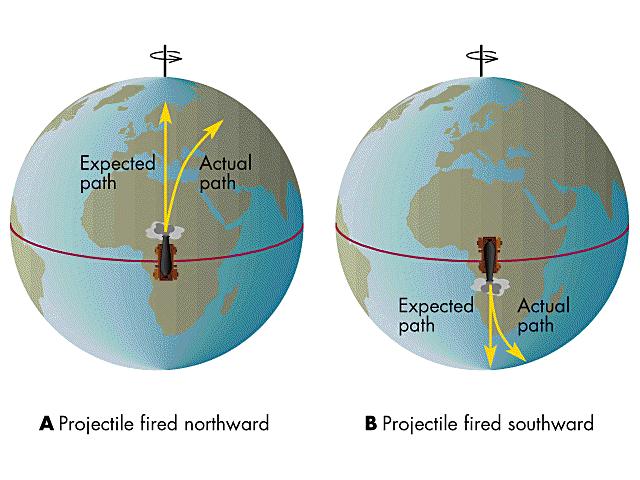
The easiest way to understand this, is to find a merry-go-round and attempt to play ping pong in the middle. Due to the rotation of the merry-go-round, a ball hit apparently straight will deviate relative to the observer. Back in the good ol’ days of artillery, small corrections had to be made to account for the earth’s rotation. If you observe the diagram above, you’ll see that the greatest effect applies to anything moving perpendicular to the direction of rotation. Apart from battles waged by cannonball which happen to face north-south, the atmospheric circulation discussed above also conveniently moves in a direction perpendicular to the earth’s rotation. When applied globally, we get this:
This explains why, most of the time, the wind always seems to be going in one direction.
Jet Stream
So where does the jet stream come into all of this? Well, the jet streams tend to fall in the gaps between the circulation since it is in those gaps where a river of air can continue unimpeded by the other effects of atmospheric circulation. The main location of jet streams is between the Hadley and Ferrel cells, and between the Ferrel and Polar cells (I’ll explain why there isn’t one at the equator in a minute).
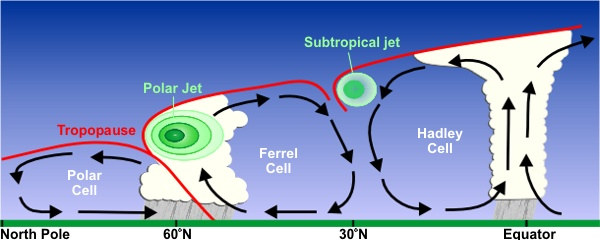
The location of the jet stream is in these ‘dead zones’ (my term) where there isn’t any strong convection to move the air around. Instead there is only the gradual overarching temperature gradient from ‘warm’ near the equator where solar radiation is the strongest, to ‘cold’ at the poles. This warm air, which wants to expand, is at a higher pressure than the cold air, so the air in theses dead zones moves away from the equator and towards the poles. In doing so, it is subject to the Coriolis effect which causes the air to flow from west to east. Since these are ‘dead zones’ and not subject to the convection of the circulation cells (our friends Hadley, Ferrel, and Polar), what started off as a very gentle temperature gradient builds up to quite a substantial jet stream. Substantial enough that a flight from Los Angeles to New York is a full hour shorter than the return journey. (Since there is no temperature gradient over the equator itself, there is no jet stream sandwiched between the two Hadley cells there)
So there is the basic science behind atmospheric circulation.
Climate Change Effects
So how does climate change impact this? It comes down to one thing – the temperature gradient. The warming in the arctic has resulted in a weaker temperature gradient (a smaller difference between the extremes of hot and cold). A weak temperature gradient leads to a weaker jet stream. A weaker jet stream will have a tendency to meander around more than a stronger jetstream would (think about how much easier it is to ride a bike in a straight line when you’re going quickly, as opposed to when you’re going slowly). It’s that simple.
It’s a fundamentally chaotic and unstable system, and the more energy you remove from these drivers of the larger global system, the more chaotic it will become because the system will be increasingly influenced by smaller-scale climate drivers such as mountains, land-sea breezes, and local distribution of land/water. This is a point that many oversimplified arguments against global warming miss – “warming” in real-world terms doesn’t always translate to warmer temperatures (although, on average, it will), it changes the way our climate works and makes it more unpredictable and extreme. This is just one of many ways in which the change in climate change is being felt (along with, y’know, 2013 being the hottest year in Australia ever) and it’s about time we woke up and stopped denying ourselves the courage to take action and make a change.
Don’t forget to check out the other articles in the Earth Debate series.
Footnotes
- This isn’t quite true; very large systems are affected by the Coriolis effect because their size is significant in relation to the spinning of the earth. Very small systems, while still affected, are influenced overwhelmingly by other factors like the shape of the toilet bowl and the direction of the water jets ↩
The raw data from the NASA satellites measuring global atmospheric temperatures has now remained essentially FLAT for nearly the past 15 years. This is one “cold hard fact” you seem to gloss over in your analysis.
Despite the steady march upward of the % of CO2 over this period, we observe no further correlation with commensurate rising global average temps. This indicates that the the actual measured data over an extended time frame has cast strong doubt on your statement that the science of climate change is well understood. Clearly the hypothesis of AGW/CO2 is bogus in some major ways, and something else more than mere anthropogenic CO2 increases is driving climate variation.
Hi Richard, thank you for your comment.
I’m glad you took the time to make an erroneous and unsupported claim about “raw data from the NASA satellites”. If you would actually like a meaningful discussion, please bring some supporting evidence, or at least an attempt at a scientific argument against ANYTHING that I’ve said.
Even though you, yourself did not present either an argument or any evidence, in the spirit of goodwill I have included a link to a peer-reviewed paper refuting the claim that there has been no warming since 1998.
http://www.aussmc.org/documents/waiting-for-global-cooling.pdf
Daniel, We would like to use your coriolis figures (projectile fired northward, … fired southward) in a an oceanographic text to be published by Wiley. How do we get your formal permission and, if you do give it, how do you want the credit-line to read?
Linda Torres (a climate-change believer, and very worried too)