The Earth Debate: Part 4
The famed classical economist Thomas Malthus once said: “The power of population is indefinitely greater than the power in the earth to produce subsistence for man. Population, when unchecked, increases in a geometrical ratio. Subsistence increases only in an arithmetical ratio. A slight acquaintance with numbers will show the immensity of the first power in comparison with the second.”
With the world population at 7 billion, it is difficult to question the insight of this 19th century philosopher-economist. But even Malthus couldn’t have predicted the environment of the early 21st century. Looking at population figures from the history of human history, one indeed observes exponential growth. The total population of the world in 1500 was about 500 million. In roughly 1800, the world’s population was 1 billion, it didn’t double again for another 130 years, in 1930. 44 years later, in 1974, we had hit 4 billion. It only took 25 more years to add another 2 billion. Those readers who have a “slight acquaintance with numbers” will realize that these numbers are fairly consistent with models for exponential growth. So are we ultimately doomed to having our numbers controlled only by disease, famine, or warfare?
In a word – no.
To understand this, we need to examine a concept called the “logistical growth model”. When observing the population of just about anything except humans, scientists noticed that initially, when resources were plentiful, the growth rate is exponential. Eventually, resources become scarce, and the growth slows down and eventually stops. This can be modeled by the differential equation:
![]()
![]() basically means “the rate of population growth over time”, r is a constant which defines the growth rate and K is the “carrying capacity” or the maximum population that can be sustained. Let’s think this through – at the start, when N (the population) is small relative to the carrying capacity,
basically means “the rate of population growth over time”, r is a constant which defines the growth rate and K is the “carrying capacity” or the maximum population that can be sustained. Let’s think this through – at the start, when N (the population) is small relative to the carrying capacity, ![]() is a small number. This means that
is a small number. This means that ![]() is a value close to 1. So the rN dominates. The solution to
is a value close to 1. So the rN dominates. The solution to ![]() is simply
is simply ![]() – exponential growth. When N approaches the carrying capacity K,
– exponential growth. When N approaches the carrying capacity K, ![]() becomes a value close to 1, so
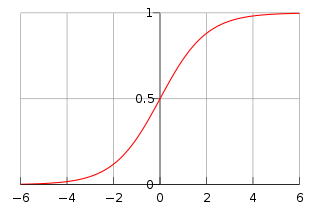
becomes a value close to 1, so ![]() goes to 0 making the whole thing go to zero – growth stops. Perhaps a graph would be instructive at this point:
goes to 0 making the whole thing go to zero – growth stops. Perhaps a graph would be instructive at this point:
I’ve been very lazy here, this is the graph of ![]() (because it was easy to plot). The actual solution to the equation above is
(because it was easy to plot). The actual solution to the equation above is ![]() (where
(where ![]() is the initial population) which would put different numbers on the axes but can easily be shown to have the same shape. The carrying capacity can be limited by any number of things such as the amount of available food, the amount of available space, and so on. Curiously, while the overall trend of global population doesn’t appear to follow this curve (or at least seems to only be following this curve as far as the initial stages are concerned) there are some countries that do follow this curve. Moreover, these countries are the developed countries which are nowhere near pushing the boundaries of their carrying capacity (measured in food/space consumption vs production). When we think about this, it doesn’t seem to make sense – the growth levels off because of a scarcity of resources, yet it is in the developing countries where the resources are scarce, while in developed countries resources are plentiful. Why this apparent paradox?
is the initial population) which would put different numbers on the axes but can easily be shown to have the same shape. The carrying capacity can be limited by any number of things such as the amount of available food, the amount of available space, and so on. Curiously, while the overall trend of global population doesn’t appear to follow this curve (or at least seems to only be following this curve as far as the initial stages are concerned) there are some countries that do follow this curve. Moreover, these countries are the developed countries which are nowhere near pushing the boundaries of their carrying capacity (measured in food/space consumption vs production). When we think about this, it doesn’t seem to make sense – the growth levels off because of a scarcity of resources, yet it is in the developing countries where the resources are scarce, while in developed countries resources are plentiful. Why this apparent paradox?
Put simply, the paradox is a result of our ability to use our brains to plan our lives. That is not to say that people living in developing countries lack this ability, but because they are poorer, they don’t have the luxury of being able to exercise this ability. When a country is wealthy, the life expectancy of its citizens generally increases. When life expectancy is good, parents don’t feel the need to have lots of children because there is a much higher chance that they will survive to adulthood. Wealthier countries also tend to be more urbanized, resulting not only in space constraints, but also in a diminished need for “farm hands” – a typical role for the offspring of families living in rural areas. In addition, better education and empowerment of women also contributes to a lower birth rate. If we were just like all the other animals, we would do what most other animals do when they’re bored – kill each other and make babies – both very easy paths to short term gain (and long term ruin), but thanks to our brains we can see past that (at least most of the time).
However, it is precisely these brains that may lead to our own undoing. Obviously, Malthus underestimated our ability to control our own population well before we hit our carrying capacity ceiling. He also underestimated our ability to dramatically increase our food production (although we’re not doing it in a very sustainable way – more on that later). Despite many predictions, globally we still produce far more food than we consume, although food distribution follows income distribution and that is obviously lacking. Of course, just because we are able to control our population before we hit our carrying capacity ceiling doesn’t mean that we will. The most optimistic projections estimate that the world population will level off at about 9 billion people, other predictions have that number as high as 12 billion, which doesn’t look like that much more on a graph, but is actually a very significant difference. While some argue (and I disagree) that we are already past carrying capacity, there is certainly a strong case that 9 billion will be pushing it, and 12 billion will almost certainly be over it. If this really is the case though, if the logistical model is to be believed, shouldn’t we already be seeing a dramatic leveling-off of populations across the board and not just in developed countries?
The reason that this hasn’t happened is because there is significant lag between the depletion of resources and the response resulting from it. An example I like to use to illustrate this is fish because it is easy to understand and the time-frame in which things happen in the fish example is easy enough for the average person to grasp.
Let’s just say for the sake of illustration that there are only two things that matter in our hypothetical earth – humans and fish. Humans eat fish. The amount of fish eaten is directly proportional to the number of humans. If the human demand for fish exceeds the amount of fish that there is, the human population will decline. Obviously, if the human population declines enough, the demand for fish will decrease and the fish will be able to replenish their numbers. For simplicity’s sake, we will assume that the fish population follows the general pattern of the logistic function discussed previously. The human population also follows this pattern but the carrying capacity is not a fixed value, but is determined by the number of fish. What happens?
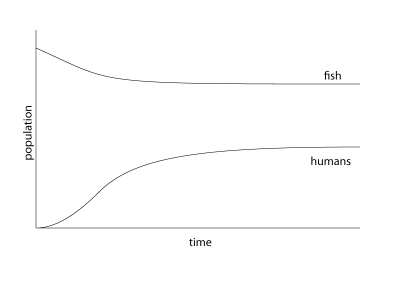
Well, it depends. What does it depend on? It depends on the growth rate, or more accurately, the ratio of the growth rate of humans to fish. If the growth rate of the fish is very large compared to humans, the number of humans climbs steadily as the number of fish declines slowly and they eventually reach equilibrium.
The number of fish, and the number of fish that each individual human eats will obviously change all the numbers, but the shape of the graph would remain the same. What is basically happening, mathematically is ![]() , that means rate of growth of fish is the same as the rate of growth of humans (and this “rate” of growth happens to be zero). The reason it is zero is simple – if the number of humans was growing, the number of fish would decline, the growth of the number of fish is limited by carrying capacity for fish, and the growth of the number of humans is limited by the number of fish. Easy. If the growth rates for fish and humans are much closer, one of two things can happen.
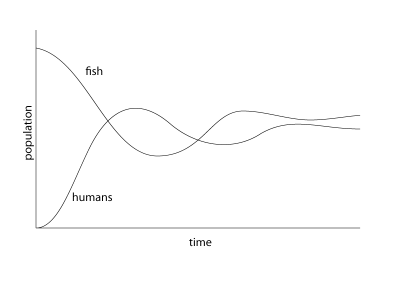
, that means rate of growth of fish is the same as the rate of growth of humans (and this “rate” of growth happens to be zero). The reason it is zero is simple – if the number of humans was growing, the number of fish would decline, the growth of the number of fish is limited by carrying capacity for fish, and the growth of the number of humans is limited by the number of fish. Easy. If the growth rates for fish and humans are much closer, one of two things can happen.
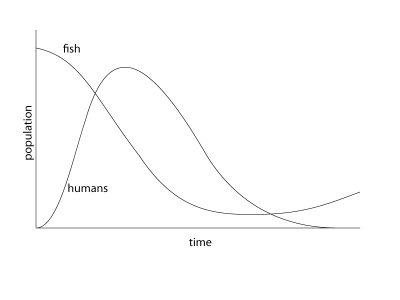
The populations initially react very quickly to each other, but they eventually even out and reach equilibrium. The key thing to remember here is that we are solving the same equations, the only thing that has changed is the constant that tells us how quickly each of the populations can grow. If we tip the ratio just slightly so that ratio that humans can grow relative to the fish is a tiny bit higher, then the following happens:
It doesn’t take a genius to figure out what’s going on here. I don’t want to sound too alarmist, but this is precisely what is happening. Our rate of population growth may be slowing ever so slightly, but our rate of consumption (which is what actually matters here) is still increasing at an alarming rate.
Now I don’t want people to start thinking that I have objections to eating fish. I love fish. But we are simply using our resources much faster than they can be replenished and it will eventually bite us in the arse. Fish are a particularly good example because the feedback loop is very quick, but we are actually doing the same thing with agriculture as well (the energy that goes into producing food is now much greater than what we get out of it, more on this later).
How do we get the maximum out of our fish stocks? If we look at our logistic curve, we see the answer. For any given amount of fish stock, we need to consume at exactly the rate at which those stocks can be replenished. Now it remains to figure out when that rate is the highest. We could go to the trouble of solving the differential equation to find the maximum (and it isn’t very difficult), but looking at the graph is much easier. By symmetry, the maximum rate of growth occurs at a half of the carrying capacity. So… everyone just agrees to fish his or her fraction of whatever that sustainable number is, and we’ll all be fine right? Not quite.
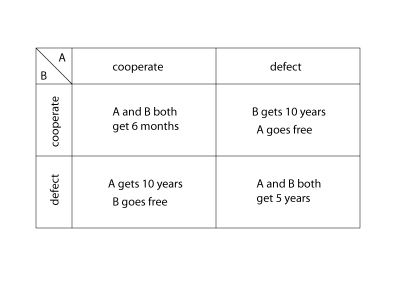
Most people are familiar with the prisoner’s dilemma. Where the police have caught two suspects but haven’t enough evidence to convict. They are separated and each offered a deal whereby if they betray the other suspect, and the other suspect remains silent, then they can go free. The payoff matrix is shown below:
At first glance, the obvious thing to do would be for both to cooperate. But if you take the view of any of the individuals, you discover that the equilibrium (indeed, the Nash Equilibrium) is to defect. This is because, no matter what the action of the other suspect, you are always better off if you defect. In game-theory-speak we say that cooperating is strictly dominated by defecting.
What does this have anything to do with fish? Everyone can cooperate and limit their catch of fish, which is generally recognized as being the optimal solution. But if a fisherman decides he wants to fish more… if nobody else does, then that makes it easier for him to fish more fish, if others do and he doesn’t, then he loses out because the fish are more difficult to fish because there are fewer of them, and if everyone decides to disregard the limit, then everyone loses. Since the damage caused by any one individual is shared by everyone, the incentive for that individual not to cause that damage is very easily outweighed by any benefits that the individual might gain – the classic tragedy of the commons.
In part 5: Energy crunch, subsidies, and money supply
Don’t forget to read my other articles in the Earth Debate series.

Leave a comment